You've planned, undertaken and measured your activities; now what do you do with that data? This crucial step can provide you with the intellegence to improve a project or facts that will gain supporters, it can be immensly powerful when used correctly.
Visualising your data
We live in exciting times for data as there are a multitude of tools to help gain an understanding of your outcomes. Below are some of the popular examples:
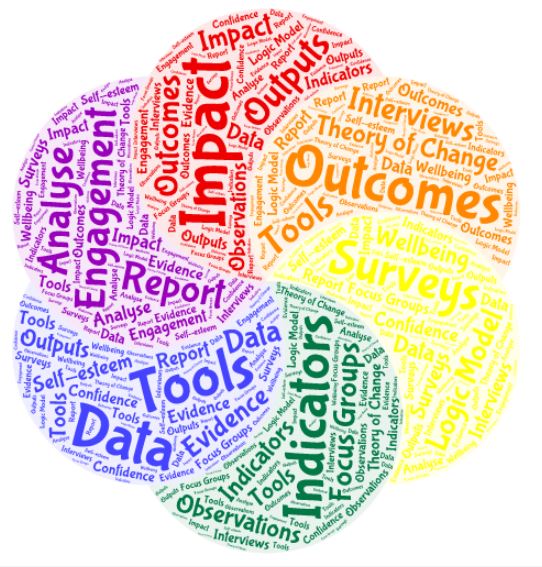
Word Clouds
These popular visualisations are easy to make and great for showing key themes from focus groups and interviews. The Cloud above was created for free at Wordart.com
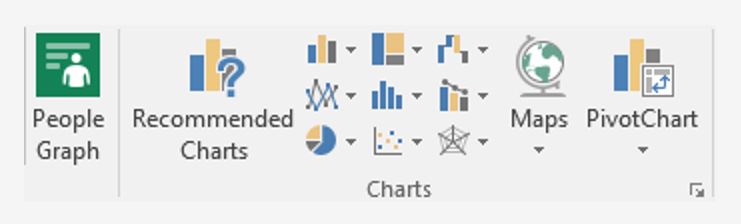
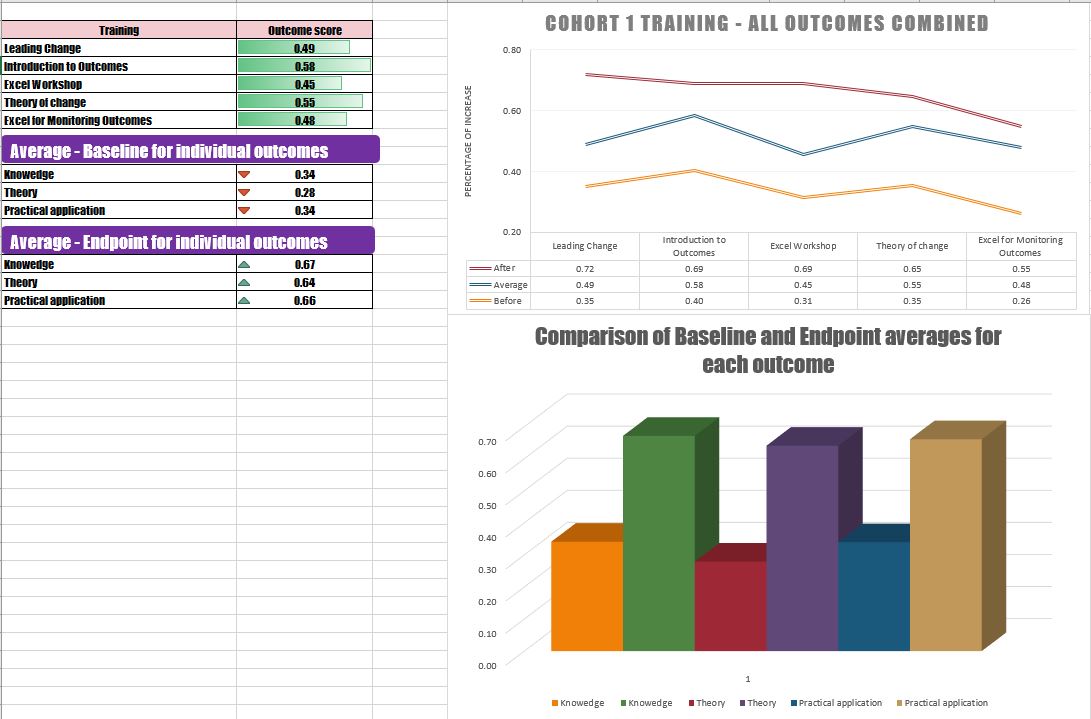
Excel
Charts and graphs have never been simpler to make thanks to Microsoft's Excel. You may be able to access the Excel for Monitoring training or learn from Microsoft's Excel videos here.
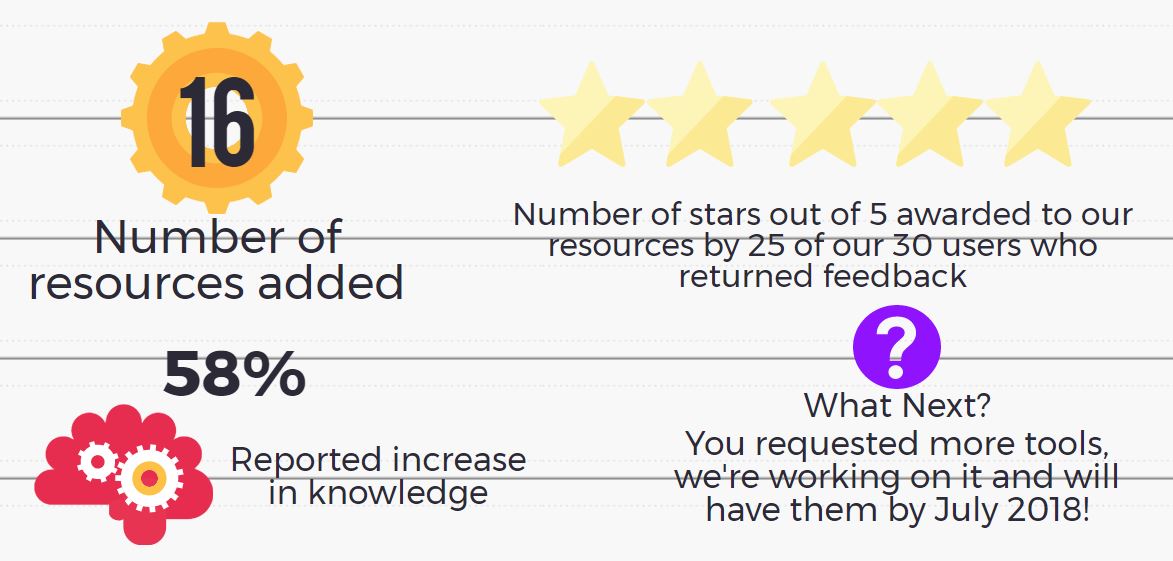
Infographics
Infographics make data so much easier to read and have also become popular for creating Annual Reviews or Impact reports.
There are a number of online sites that provide free Infographic templates such as Canva and Piktochart but Microsoft's Powerpoint can also be used to create some really impactful Infographics!
Impact Reports
Impact Reports can be a powerful way to explain how you are making a difference. NPC's 'How to write an impact report' and 'Result! What good impact reporting looks like' are an ideal place to start.
Dashboards for monitoring performance
Keeping on top of your data can help you to monitor the service you deliver. By creating Excel spreadsheets that staff and volunteers populate or adopting a database that you can run reports from, you can take the data a step forward by making a 'live' dashboard.
It will take time to put together but once in place it, you will be able to pull off the data when you need it. See Microsoft's guidance on using Excel and Powerpoint to make a dashboard.
Most importantly
No matter how you plan to present your data; make sure you learn from what your data is telling you. Your outcome tools should provide you with an insight into what is working and what is not. Make sure you are setting clear actions for improvement based on this feedback and share these with your stakeholders.
Head back to resources: